
< Cust_Spend_Data.csv 파일을 통해서 고객의 의류소비, 음료소비, 음식소비 데이터를 통해서 비슷한 고객으로 그룹핑 하자 >
import numpy as np
import matplotlib.pyplot as plt
import pandas as pd
df = pd.read_csv('../data/Cust_Spend_Data.csv')
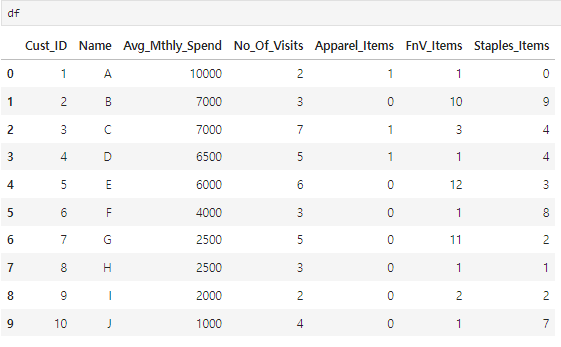
df.isna().sum()
Cust_ID            0
Name               0
Avg_Mthly_Spend    0
No_Of_Visits       0
Apparel_Items      0
FnV_Items          0
Staples_Items      0
dtype: int64
X = df.iloc[:,2:]

import scipy.cluster.hierarchy as sch
import matplotlib.pyplot as plt
#덴드로그램을그릴때메소드는'ward'라는명칭을많이씀
sch.dendrogram(sch.linkage(X,method='ward'))
plt.show()

ㄴ 3개 그룹으로 분리하자.
from sklearn.cluster import AgglomerativeClustering
# 깡통 인공지능 생성
hc=AgglomerativeClustering(n_clusters=3)
# 학습과 예측을 동시에
hc.fit_predict(X)
array([2, 1, 1, 1, 1, 0, 0, 0, 0, 0], dtype=int64)
y_pred=hc.fit_predict(X)
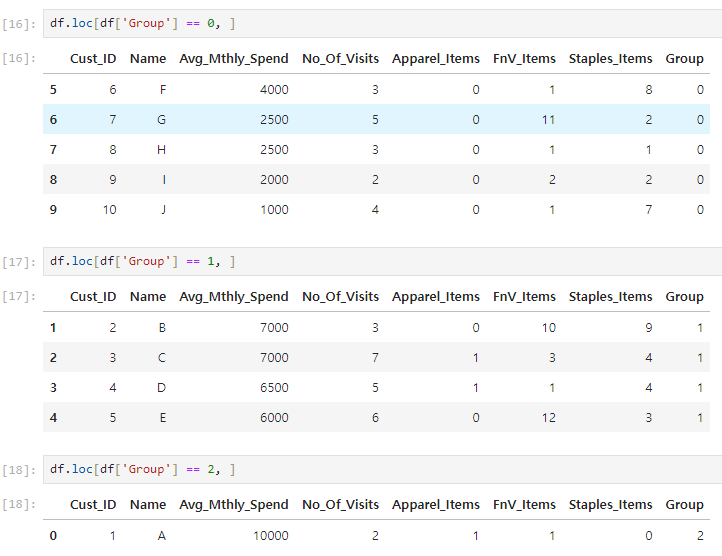
# 원본에 예측값을 넣어서 비교해 보자.
df['Group']=y_pred
df.loc[df['Group'] == 찾길 원하는 그룹, ]
##kmeans로도해보자
from sklearn.cluster import KMeans
wcss = [ ]
forkinrange(1,5+1):
kmeans = KMeans(n_clusters=k,random_state=5)
kmeans.fit(X)
wcss.append(kmeans.inertia_)
wcss
[74525310.2, 14500293.600000001, 5387740.75, 2187714.5, 854349.4166666667]
plt.plot(range(1,5+1),wcss)
plt.show()
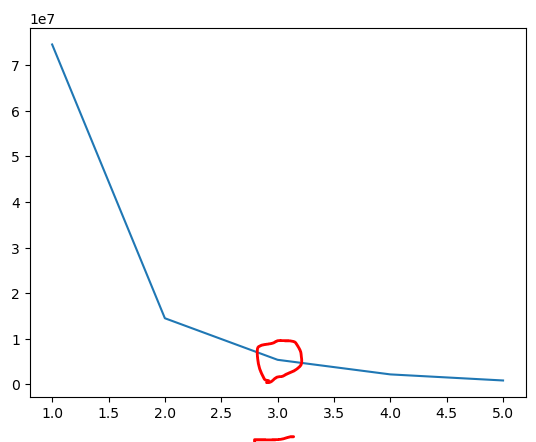
ㄴ 그룹은 3개로 나누자
kmeans = KMeans(n_clusters=3,random_state=5)
y_pred2 = kmeans.fit_predict(X)
#hcc로예측
y_pred
array([2, 1, 1, 1, 1, 0, 0, 0, 0, 0], dtype=int64)
#kmeans로예측
y_pred2
array([2, 0, 0, 0, 0, 1, 1, 1, 1, 1])
# 숫자는 중요하지 않고 두방법 모두 비슷한 비율로 그룹을 묶은걸 볼수 있다.